The monitoring question and reporting unit
This implementation guide considers Anomaly Detection in the context of Potato production fields, with SMAP surface soil-moisture products as the selected data source. The purpose is to design a defensible monitoring workflow before purchasing imagery, selecting software settings or committing to an operational alert. Treat the proposed combination as a starting point for a feasibility assessment: the landscape may contain features that the product cannot resolve, and the relevant physical variable may differ from the decision a manager wants to make. Establish that relationship explicitly, then document what additional observations are required.
Landscape context and independent observations
For potatoes, the decision unit should be a field with a known planting date and management stage. Canopy monitoring can help prioritize scouting or compare development within that unit. It does not directly reveal tuber number, marketable size or the biological cause of a patchy canopy response. Define the reporting unit, the observed variable and the action a finding could trigger before selecting an indicator. Retain these definitions so evaluation addresses the management question rather than visual appearance.
Row structure, ridging, irrigation and exposed soil dominate early observations, while canopy senescence becomes expected near maturity. Terrain can vary sharply in upland production areas. Compare dates at similar developmental stages and retain soil, slope and recent management information when defining the appropriate reference condition for a field. Record the observation window and comparison population. Consistent processing cannot compensate for dates or spatial units representing different processes. Preserve acquisition and context information so another analyst can reconstruct the comparison.
An apparent decline may reflect planned haulm destruction, natural maturity, waterlogging, drought or disease. Broad satellite observations cannot distinguish these causes reliably without field evidence. A vigorous canopy also does not guarantee suitable tuber quality, because below-ground development and harvest defects are not directly observed in a reflectance image. Treat competing explanations as hypotheses to test, with insufficient evidence retained as a legitimate result. Avoid forcing every difference into a problem class. Identify the additional observation that would change the interpretation.
Use dated field inspections with canopy condition, management actions and crop stage recorded consistently. Independent harvest samples are needed to evaluate any tuber-related prediction. Deliver inspection zones and observation confidence together, avoiding disease or yield labels where the imagery provides only evidence of an unusual surface condition. Document reference selection and independence from threshold or model tuning. Preserve usable coverage and rejected observations. State the conclusion's spatial and temporal support so later updates remain comparable without overstating measured evidence.
Select the measurement and data product
SMAP soil-moisture products describe near-surface water content using microwave observations and, for some product levels, modelling or additional inputs. Standard radiometer information has a broad physical footprint even where an enhanced product is posted on a finer grid. Distinguish a retrieval product from a model-assimilated root-zone estimate before selecting it for drought, irrigation context or a regional hydrological analysis in a GIS.
Apply retrieval-quality and surface-condition flags, and examine open water, frozen ground, dense vegetation and radio-frequency-interference guidance. Retain units, observation time and the selected product's definition of soil depth. When summarising a catchment or administrative area, consider its size relative to the effective footprint. Interpolating a coarse moisture field to small raster cells changes its representation, not the scale of the underlying microwave measurement.
Surface soil moisture is not automatically equivalent to water available throughout a crop's root zone. Vegetation, roughness and mixed land-water areas can complicate retrievals, and irrigation may affect only a small fraction of a coarse footprint. Compare patterns with independent soil measurements and weather information. Use the product as regional context where appropriate, while field-specific irrigation decisions require observations and models matched to the actual field.
Prepare and test the analysis
Define an anomaly as evidence for investigation rather than an automatic diagnosis. The same unusual signal can arise from surface change, observation quality, seasonal timing or a change in processing. Define the decision unit, observation period and consequence of an incorrect result before choosing processing settings. Separate the physical measurement from the management interpretation. The workflow should explain when available imagery is adequate, when more observations are needed, and who is responsible for reviewing uncertain cases.
Compare the observation with a documented local baseline, then check quality and supporting variables. Route candidates through an explicit review rule that separates measurement reliability from the severity of a possible event. Keep a small representative test area and retain the original inputs. Record the product identifier, processing level, coordinate reference system and every setting that changes the numbers. Change one assumption at a time so that a reviewer can distinguish a processing effect from a real difference on the ground.
With a hypothetical baseline mean of 20 and standard deviation of 2, a value of 26 lies three standard deviations above the mean. This arithmetic alone does not establish event probability. This is an illustrative calculation for checking the logic, not a measured outcome or a universal threshold. Repeat it on known inputs before processing the full region. Then vary the relevant assumption and document whether the decision changes, including cases where the available evidence cannot support a confident answer.
Distributional assumptions may fail, and testing many locations generates some extreme values by chance. A compelling map of outliers can therefore overwhelm inspection capacity unless quality and context guide prioritization. A plausible color pattern alone cannot resolve these competing explanations. Review representative failures alongside apparently successful locations, and compare observations made under similar conditions. Preserve a separate uncertainty or exclusion layer so that unsupported areas cannot quietly enter summaries as if they had the same evidential strength as reliable observations.
Evaluate alerts against independently reviewed event and non-event cases, including ambiguous examples. Report false-alarm workload and missed events, then select operating rules that fit the actual response process. Set the acceptance rule before examining the final map. Use independent evidence that represents the difficult conditions as well as the easy ones. Report how many observations passed, which failed and why. A threshold that works in this test area still needs checking before transfer to another landscape or season.
Deliver the anomaly score, baseline version, quality flags and review outcome separately. Preserve the distinction between candidate, confirmed event and unresolved case when reporting trends to decision makers. Package the analytical layer with its quality information and a short reproduction note. Include the acquisition dates, processing assumptions, limitations and responsible reviewer. Preserve stable identifiers across maps and tables so another analyst can trace a reported number back to its inputs and repeat the comparison without guessing the settings.
Interpret the combined evidence
Read the landscape and product sections together before applying the analysis procedure. In this guide, Potato production fields defines the reporting context, while SMAP surface soil-moisture products defines the available measurement; Anomaly Detection supplies the processing and review question. These roles are deliberately separate. A working data connection does not establish that the measurement answers the management question. Reject a combination when the target is smaller than the effective observation scale, when the required season has no usable observations, or when the relevant property is not measured by the sensor. Retain that rejection in the project record so that an attractive demonstration does not become an unsupported operational promise.
Acceptance checks before delivery
Write acceptance conditions before inspecting the final map. Specify the reporting boundary, observation period, minimum valid coverage, reference sampling design and the consequence of an incorrect alert. Use project-specific values agreed with the recipient rather than copying a threshold from an unrelated landscape. Keep a small set of independent observations outside all parameter selection. Review omission and commission errors separately and examine boundary areas, rare conditions and missing dates. If the available reference observations do not cover the intended operating conditions, narrow the stated scope of the result instead of claiming that an apparently successful demonstration proves general reliability.
A useful GIS delivery contains more than a colored image. Export the analytical values where licensing permits, the validity mask, reporting geometries with stable identifiers, and a concise record of product names, acquisition dates, processing versions, coordinate reference system and resampling choices. Distinguish valid zero values from missing observations. Provide the area or count of usable measurements for every reporting unit and explain which units were excluded. A colleague should be able to trace a suspicious statistic back to the underlying observation without reconstructing the entire project from screenshots. Store the interpretation and its limits beside the data, not only in a presentation.
Connect the result with an ITSensing workflow
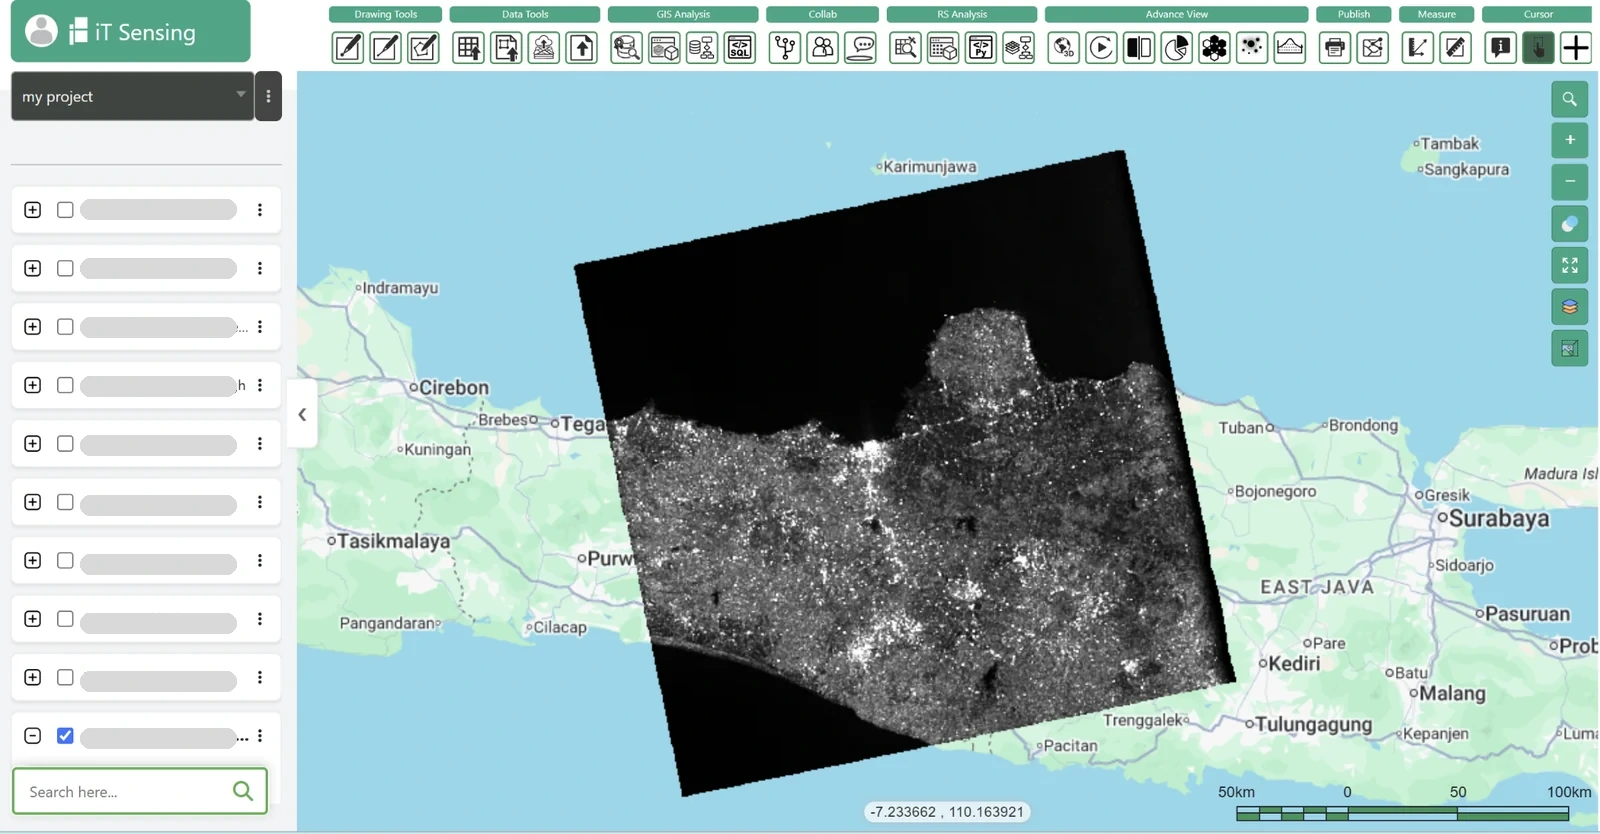
Use the ITSensing satellite catalog and remote sensing tools to evaluate the parts of this workflow that are available for the selected account and data source. Begin with a small representative area and compare the output with a trusted reference before scaling up. The product links below lead to the catalog, tools, documentation and plans so the team can check data access and processing requirements directly. This guide describes an analytical procedure; it does not assert that every named product, algorithm or export format is supplied natively by ITSensing. Where a step uses an external GIS or specialist tool, keep its inputs and outputs in the same reproducibility record.