A flood map cannot assume every wet surface becomes dark
Smooth open water often looks dark in a side-looking radar image because much of the incident energy is reflected away from the instrument. That familiar pattern is useful, but it is not a complete description of flooding. Where water surrounds upright vegetation, a different scattering path can return more energy toward the radar. A wetland can therefore show increased backscatter under some inundated conditions, rather than simply becoming another dark water patch in a threshold-based map.
The important word is can. A brighter response is neither an automatic flood label nor a guarantee that water beneath every canopy is observable. This article explains the physical idea of double bounce and develops a comparison strategy for interpreting it. The illustrations are conceptual, with no real SAR scene or flood event processed. The aim is to connect a candidate radar change to plausible structure, acquisition conditions and independent observations instead of treating brightness as a direct measurement of water depth.
1. Follow the possible return path
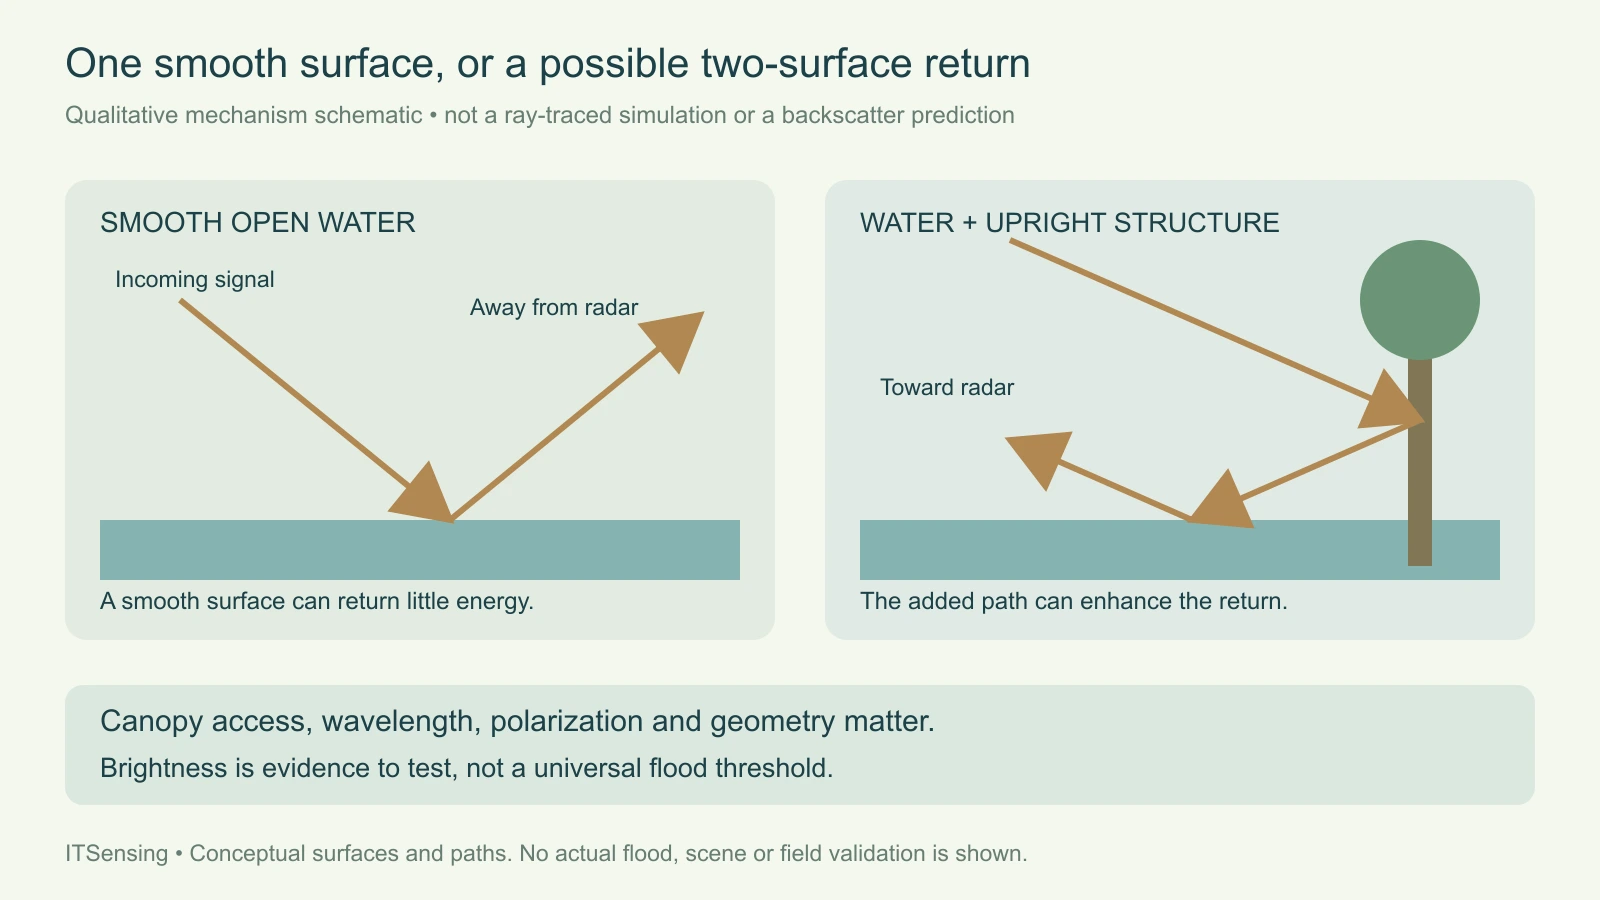
A smooth horizontal water surface and a suitable upright stem can form a two-surface interaction. Energy reflecting between those surfaces can travel back toward the radar rather than away from it. Esri's SAR flood-interpretation documentation illustrates this double-bounce mechanism for flooded vegetation and other upright targets. It distinguishes that path from scattering within a vegetation volume and from reflection off a single smooth surface. These are useful physical categories, not mutually exclusive labels for everything contained within a real resolution cell.
Imagine two otherwise comparable wetland patches viewed under the same acquisition conditions. One is open, smooth water. The other includes water around exposed upright stems. The second patch has a possible return pathway that the open-water patch lacks. Whether that pathway contributes strongly enough to distinguish the observations depends on the actual structure and signal access. The schematic therefore describes an available mechanism rather than assigning a numerical backscatter value or asserting that every flooded stem produces the same contrast. [1]
2. Ask whether the radar can interact with the lower structure
Water beneath a dense canopy can remain difficult to detect if the observation is dominated by the canopy itself. The JRC flood-monitoring feasibility report explains that vegetation response depends on the observing system and on access to the relevant scattering elements. Wavelength, polarization, incidence geometry and vegetation characteristics belong together in that assessment. The existence of standing water is not sufficient to ensure a strong, separately identifiable return from the water-and-stem interaction in a particular dataset.
This is why a result obtained with one radar configuration should not be transferred to another by copying its display colors or threshold. The same place can provide different scattering mixtures to different observations. Retain the actual frequency band, polarization channels, viewing geometry and vegetation state with each interpretation. If the required lower-canopy interaction is not supported by the available data, preserve an unresolved status rather than relabel the absence of a clear radar contrast as evidence that the ground is dry. [2]
3. Keep polarization and display color attached to the product
NASA's UAVSAR product description provides an instructive example from airborne, fully polarimetric L-band observations. Its false-color composite uses polarization intensities to help separate dominant scattering behavior, and its description associates some pink tones with inundated vegetation. The page also states that this is a qualitative rendering that needs land-cover context. Those colors belong to that particular composite definition; they are not a natural color of flooding or an absolute class that can be copied into any radar image.
For another product, read which channels or derived quantities were assigned to red, green and blue, and how they were stretched. A display can change while the underlying measurements stay the same. Inspect the quantitative bands alongside the composite, including their units and processing state. A single bright channel, a channel ratio and a color mixture describe different representations. Keep the display recipe in the record so an apparent new wetland color can be traced to its actual inputs. [3]
4. Build a comparison that tests a hydrological explanation
Choose a reference observation with compatible radar geometry, polarization and processing, then compare the same ground support. Keep the acquisition dates and relevant vegetation season together. The question is whether the changed signal is consistent with a new water-and-structure interaction, not merely whether two independently stretched pictures look different. A useful comparison includes candidate inundated vegetation, nearby open water and suitable stable reference areas, allowing the analyst to examine more than one expected response within the scene.
Define the comparison units before inspecting the strongest changes. A narrow water margin, a stand of trees and a mixed boundary cell need not share one response. Retain unresolved canopy, terrain shadow and poor-quality coverage as separate limitations. A persistent structural return deserves a different explanation from a new seasonal response. When available, use local water observations and dated land-cover information to test the timing and setting rather than selecting only the evidence that makes the radar change appear hydrological.
5. Look for alternative causes of brightness and darkness
The same general double-bounce idea also occurs around built structures, so its presence does not uniquely identify flooded vegetation. Esri's interpretation examples include ships, containers and urban targets as well as vegetation. Conversely, smooth nonwater surfaces can have weak returns. A classifier that assigns an environmental class solely from one brightness extreme will therefore encounter physically plausible alternatives. Examine the surrounding land cover and the expected geometry of the candidate target before deciding which interpretation the evidence supports.
Water-surface roughness and changing observation conditions can also complicate a simple contrast. The JRC report discusses wind-related increases in water backscatter and the difficulty of separating some vegetated responses. These caveats do not make the physical mechanism useless; they identify what the study needs to control or investigate. Preserve alternative explanations explicitly in the review notes, and avoid making an ambiguous pixel appear certain merely by smoothing its neighboring labels into a visually continuous flood polygon. [1] [2]
6. Validate inundation rather than the attractiveness of the composite
Independent reference observations should address water presence under the relevant vegetation at a compatible time and location. A photograph of the canopy alone may not establish what happened at the ground surface, while a water observation collected after a rapid change may describe a different state. Record what each reference actually measures, its spatial support and its timing. If a field location represents only one accessible edge of a larger stand, do not silently treat it as a complete reference for the entire radar footprint.
Evaluate open water, vegetated inundation and difficult nonflooded alternatives separately when the study design allows. A high overall agreement dominated by easy dry land can conceal poor detection of the target wetland condition. Keep the independent reference design distinct from the imagery used to build or tune the mapping rule. The purpose is to learn where the inundation interpretation works and where it remains uncertain, rather than to validate the chosen rendering or confirm a visually persuasive example.
7. Report a mechanism-based finding with its limits
A careful result can state that a dated backscatter change, suitable vegetation structure and independent water evidence are consistent with inundation-related double bounce. It should also identify locations where canopy access, geometry or reference information leaves the interpretation unresolved. Keep the quantitative observations and processing metadata available beside any final class. No universal increase threshold, flood depth conversion or automatic under-canopy visibility rule follows from the conceptual mechanism described here.
The practical benefit is a richer flood interpretation. Dark open water and potentially enhanced vegetated returns can both inform a study when their physical and observational conditions are understood. Treat them as different evidence pathways and evaluate them against the target landscape. This makes SAR valuable beyond a simple dark-pixel mask while preserving the distinction between an observed radar response, a scattering explanation and a validated statement about flooding on the ground.