A field boundary rarely follows the raster grid
A crop parcel can cut across several satellite pixels while covering very different amounts of each. Averaging every touched pixel equally gives a tiny corner overlap the same influence as a pixel almost contained by the field. Fractional weighting offers a different summary: each valid observation contributes in proportion to the area shared by its cell and the parcel. The resulting number should travel with its valid area, because a weighted mean alone conceals how much of the field was actually observed.
This tutorial isolates that geometry in a short standard-library Python program. It handles an axis-aligned rectangular parcel and nonoverlapping rectangular cells in one synthetic coordinate system measured in metres. The restriction makes every intersection easy to check by hand. It is not a general polygon engine, a crop-yield estimator or a replacement for production raster tools. The useful lesson is how overlap, missing values and the denominator combine before a parcel statistic enters an agricultural monitoring table.
1. Distinguish area weights from extra information
GDAL's zonal-statistics documentation distinguishes equal weighting of included cells from fractional coverage weighting. The exactextract documentation expresses a coverage-weighted mean using each cell value multiplied by its covered fraction, divided by the sum of those fractions. For cells of identical area, covered fractions and intersection areas give the same mean. When cell areas differ, a mean intended to represent physical area must account for those areas explicitly rather than assume that every fraction refers to an identical ground footprint.
Weighting does not measure the portion of a mixed pixel that lies inside a field. The code assumes the supplied cell value represents its overlapping part, an approximation that can be weak near roads, canals or neighboring crops. Exact intersection geometry removes one source of ambiguity while leaving that representativeness assumption intact. Keep the pixel support and field size in the interpretation. A precise decimal result from a small parcel is not evidence that the satellite resolved all conditions within its boundary. [1] [2]
2. Work through four unequal overlaps
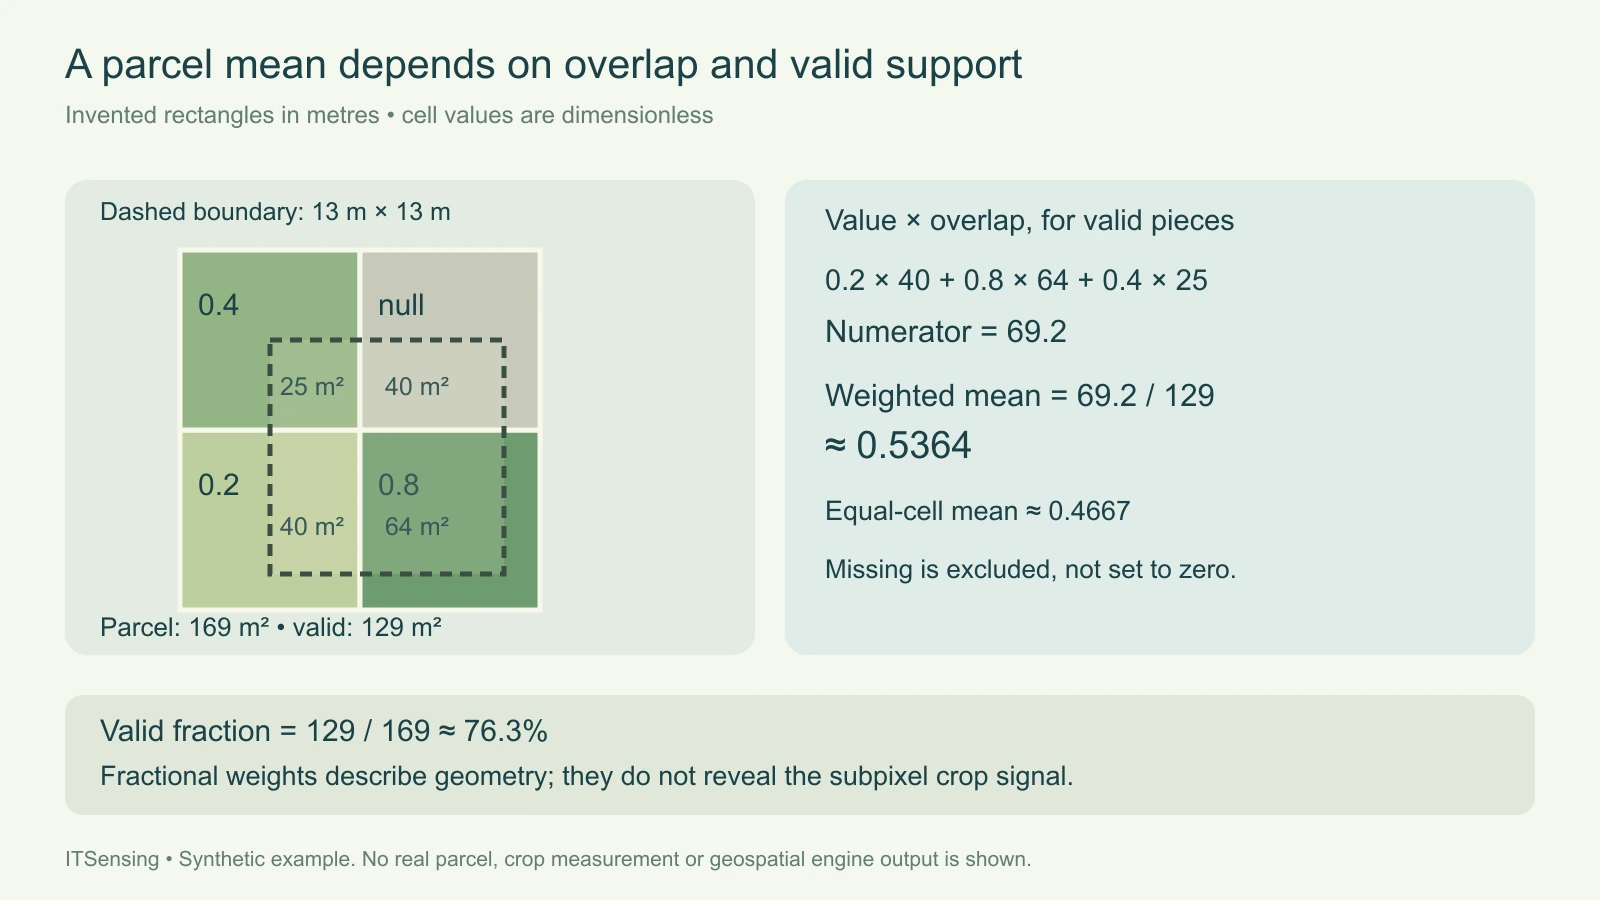
Imagine four ten-by-ten-metre cells forming a square. Starting at the lower left, their invented values are 0.2, 0.8 and 0.4; the upper-right cell is missing. A rectangular parcel extends from x equals five to eighteen and from y equals two to fifteen. Its width and height are both thirteen metres, giving an area of one hundred sixty-nine square metres. These coordinates describe a teaching geometry, not a sensor's nominal resolution or a real agricultural field.
The parcel overlaps the lower-left cell by forty square metres, the lower-right by sixty-four, the upper-left by twenty-five and the missing upper-right by forty. Those four pieces sum to the entire parcel. The valid pieces cover one hundred twenty-nine square metres. Their value-area products are eight, fifty-one point two and ten, which sum to sixty-nine point two. Dividing that numerator by the valid area produces approximately 0.5364. Averaging the three valid cell values equally would instead give approximately 0.4667.
3. Keep the missing piece out of both weighted sums
The missing cell contributes neither a value-area product nor valid area. Its overlap still belongs in the parcel's geometric support record. The observed fraction is therefore one hundred twenty-nine divided by one hundred sixty-nine, approximately seventy-six point three percent. This fraction describes available support under the input policy, not a confidence probability and not the percentage of the crop that is healthy. Report the full parcel area, intersected grid area and valid area as separate fields.
Substituting zero for the missing value changes the question. It would divide sixty-nine point two by one hundred sixty-nine and return approximately 0.4095, implicitly assigning the absent observation a real zero. A valid measured zero must still contribute its overlap to the denominator; a null observation must not. If all overlapping values are missing, the program returns no mean and zero valid fraction. It does not invent a neutral number to keep a spreadsheet visually complete.
4. Calculate rectangular intersections explicitly
For each pair of rectangles, the shared width is the smaller right edge minus the larger left edge, truncated at zero. The shared height follows the same rule for the upper and lower edges. Multiplying those lengths gives intersection area. A boundary-only touch has zero width or height and therefore contributes no area. This is why merely counting geometric touches cannot reproduce a fractional-area statistic. The program uses the same operation for every cell without rounding coordinates to grid positions.
Inputs must share the same coordinate meaning. Longitude and latitude degrees cannot be silently treated as metre lengths, and the program performs no coordinate transformation. It also rejects positive-area overlap between input cells so that duplicated coverage cannot inflate the denominator. Rotated cells, curved boundaries, holes and multipolygons fall outside this rectangle example. For real parcels, choose a suitable geospatial implementation, verify its coordinate and pixel-inclusion behavior, and compare several boundary cases against a transparent small calculation.
5. Run and inspect the reproducible example
Save the code as parcel_mean.py and the example input as parcel.json. Run the self-test before processing the example file. The returned record includes parcel area, grid-intersection area, valid area, the valid fraction of the parcel, weighted mean and per-cell overlap details. Coordinates and values are validated before aggregation. The script accepts null as missing while rejecting nonfinite numbers, malformed bounds and overlapping cells. This keeps a corrupted input from becoming an apparently meaningful agricultural summary.
Check the example's four overlap areas individually, then compare their sum with the parcel area. Next verify that excluding the missing cell changes the valid denominator but leaves the geometric intersection total unchanged. Try replacing its null with zero and observe how both support and mean change. Finally, try a parcel entirely outside the supplied grid. The result should report no observed support, rather than implying that an unrepresented field has a low crop indicator.
"""Teaching calculation for axis-aligned rectangles in one metre-based CRS."""
import json
import math
import sys


def number(value):
    return type(value) in (int, float) and math.isfinite(value)


def rectangle(bounds):
    if not isinstance(bounds, (list, tuple)) or len(bounds) != 4:
        raise ValueError('Bounds must contain xmin, ymin, xmax, ymax')
    if not all(number(v) for v in bounds):
        raise ValueError('Bounds must be finite numbers')
    if bounds[2] <= bounds[0] or bounds[3] <= bounds[1]:
        raise ValueError('Rectangle must have positive width and height')
    return tuple(bounds)


def overlap(a, b):
    width = max(0, min(a[2], b[2]) - max(a[0], b[0]))
    height = max(0, min(a[3], b[3]) - max(a[1], b[1]))
    return width * height


def summarize(zone, cells):
    zone = rectangle(zone)
    if not isinstance(cells, list):
        raise ValueError('Cells must be a list')
    checked = []
    for cell in cells:
        bounds = rectangle(cell['bounds'])
        value = cell['value']
        if value is not None and not number(value):
            raise ValueError('A value must be finite or null')
        if any(overlap(bounds, old[0]) > 0 for old in checked):
            raise ValueError('Input cells must not overlap in positive area')
        checked.append((bounds, value))
    area = (zone[2] - zone[0]) * (zone[3] - zone[1])
    numerator = valid_area = intersection_area = 0
    details = []
    for index, (bounds, value) in enumerate(checked):
        shared = overlap(zone, bounds)
        intersection_area += shared
        valid = value is not None and shared > 0
        if valid:
            numerator += shared * value
            valid_area += shared
        details.append({'cell': index, 'overlap_m2': shared,
                        'value': value, 'used': valid})
    return {'parcel_area_m2': area,
            'grid_intersection_area_m2': intersection_area,
            'valid_area_m2': valid_area,
            'valid_fraction_of_parcel': valid_area / area,
            'weighted_mean': numerator / valid_area if valid_area else None,
            'cells': details}


EXAMPLE = {'zone': [5, 2, 18, 15], 'cells': [
    {'bounds': [0, 0, 10, 10], 'value': 0.2},
    {'bounds': [10, 0, 20, 10], 'value': 0.8},
    {'bounds': [0, 10, 10, 20], 'value': 0.4},
    {'bounds': [10, 10, 20, 20], 'value': None}]}


def self_test():
    result = summarize(**EXAMPLE)
    assert [c['overlap_m2'] for c in result['cells']] == [40, 64, 25, 40]
    assert result['parcel_area_m2'] == 169
    assert result['valid_area_m2'] == 129
    assert math.isclose(result['weighted_mean'], 69.2 / 129)
    assert summarize([30, 30, 31, 31], EXAMPLE['cells'])['weighted_mean'] is None
    return {'passed': True, 'example': result}


if __name__ == '__main__':
    if len(sys.argv) != 2:
        raise SystemExit('Usage: python parcel_mean.py --self-test | parcel.json')
    if sys.argv[1] == '--self-test':
        output = self_test()
    else:
        with open(sys.argv[1], encoding='utf-8') as stream:
            output = summarize(**json.load(stream))
    print(json.dumps(output, indent=2, allow_nan=False))
Commands and inventory structure (replace every example input):
python parcel_mean.py --self-test
python parcel_mean.py parcel.json

parcel.json uses an invented grid in metres:
{"zone":[5,2,18,15],"cells":[{"bounds":[0,0,10,10],"value":0.2},{"bounds":[10,0,20,10],"value":0.8},{"bounds":[0,10,10,20],"value":0.4},{"bounds":[10,10,20,20],"value":null}]}
6. Deliver support alongside the parcel statistic
For repeated monitoring, retain a stable parcel identifier, boundary version, acquisition date, variable definition and quality policy. If usable pixels differ between dates, two means can represent different parts of the same field. Review the spatial pattern of exclusions before describing their difference as a field-wide crop response. A minimum valid-area rule can be useful, but its threshold must come from the study's requirements and evaluation; this teaching example supplies no universal acceptance percentage.
Choose statistics that match the variable. A categorical crop code is not a continuous quantity to average, and an extensive total needs different treatment from a cell-average index. Preserve unweighted and fractional results during a pilot when they help reveal boundary sensitivity. The final table should make it possible to reconstruct the numerator and denominator and recognize unsupported parcels. That is the practical value of the exercise: the field summary becomes an inspectable measurement with declared support, rather than an unexplained number attached to a polygon.