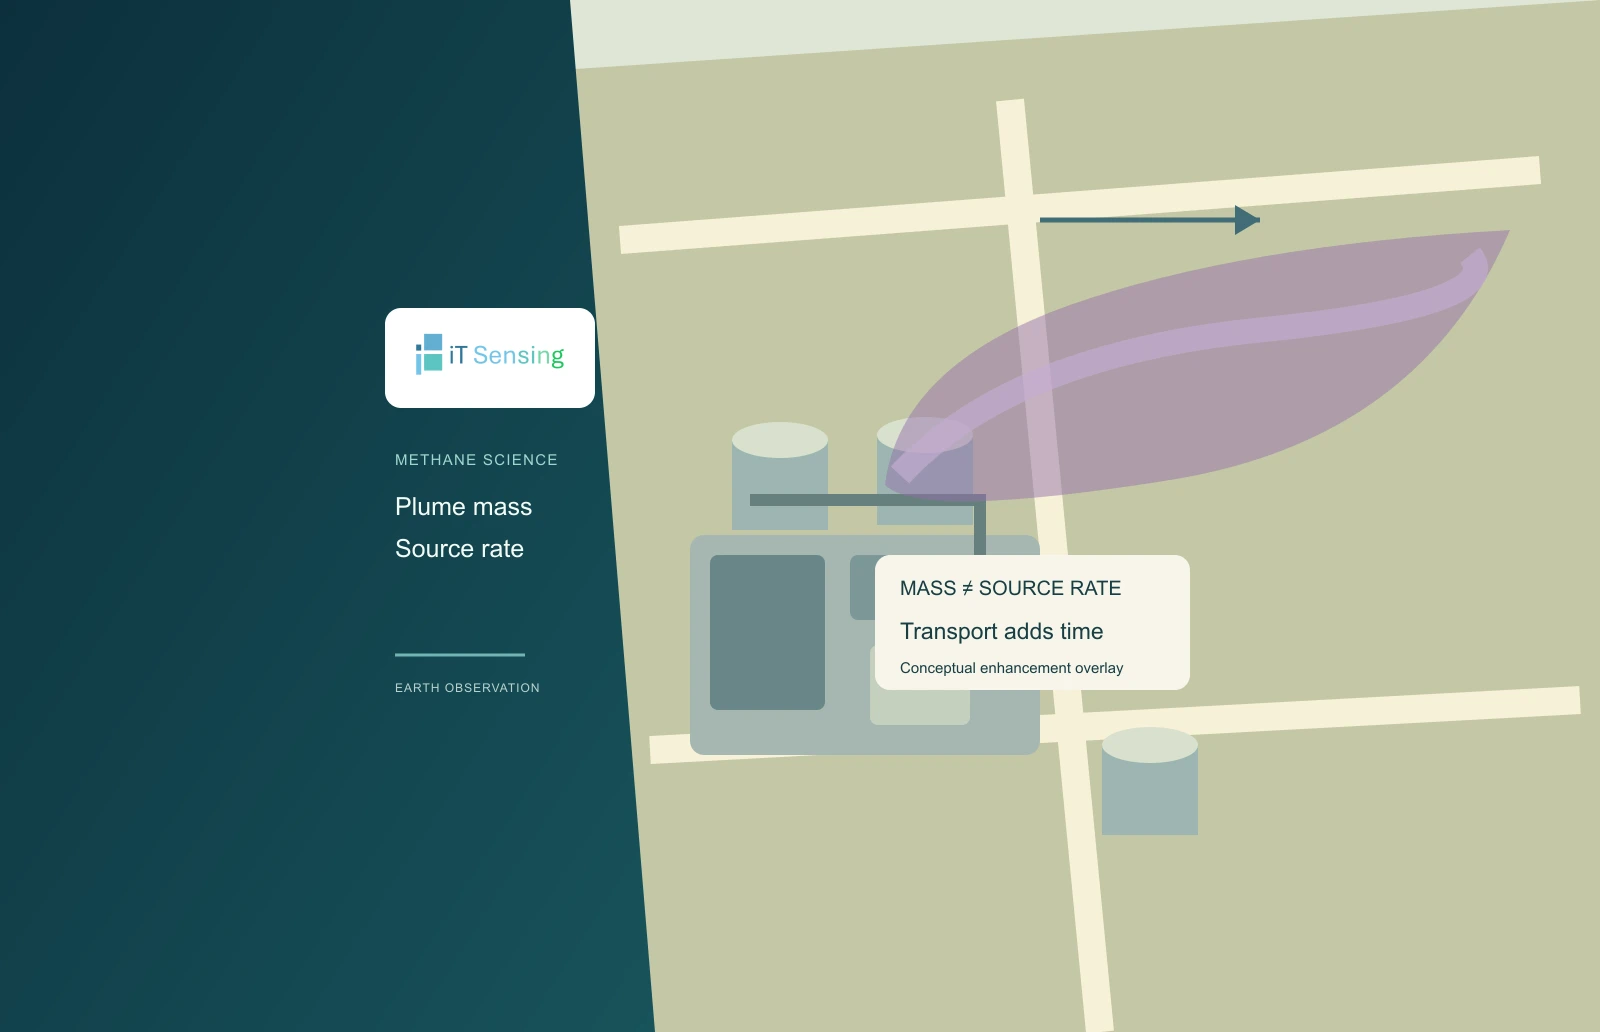
Read the units before interpreting a bright plume
A colored methane plume on an imaging-spectroscopy map can be compelling evidence for investigation, but the colors do not automatically report kilograms emitted per hour. A retrieved column enhancement, the excess mass present in a plume and the rate supplied by a source are different quantities. A further quantity, the total emitted over a month or year, requires information about time. Keeping these distinctions visible prevents an attractive snapshot from being turned into a claim that the observation cannot independently support.
This science explainer follows that chain using an explicitly invented dimensional example. It does not analyze an actual facility, identify an operator or perform an EMIT retrieval. The aim is to help readers ask precise questions of a published result: what was retrieved, how the plume boundary was defined, which transport assumptions converted mass into a rate, and what independent evidence supports any extension across time. Those questions are useful even when the final dataset has already supplied a single convenient emission-rate field.
Column enhancement describes an atmospheric departure
Imaging spectroscopy uses wavelength-dependent absorption information to retrieve a gas-related enhancement relative to an estimated background. In the EMIT research by Thorpe and colleagues, the retrieval is expressed as a concentration-length quantity before conversion to excess mass. Such a field describes additional methane along an atmospheric column under the retrieval assumptions. It is not a direct measurement of the concentration a person would breathe at ground level, nor does it contain a time denominator simply because the image has an acquisition timestamp.
A useful map therefore identifies its actual variable and units. Inspect whether a legend describes a column quantity, a converted column mass or a source-rate estimate. A timestamp tells the reader when the observation was made; it does not transform one of those physical quantities into another. Also keep the background and quality decisions available. A plume is identified against surrounding observations, so an interpretation that changes when the background is revised needs that dependence explained rather than hidden behind a fixed color ramp. [1]
Integrated mass enhancement depends on the included plume
Integrated mass enhancement, often abbreviated IME, combines the excess column mass over the selected plume area. In a discretized calculation, the contributions depend on each included pixel's column enhancement, area and conversion into mass units. The result has units of mass. It represents the excess methane assigned to the detectable plume under those choices, rather than every methane molecule released by the source over an unspecified period. The EMIT paper describes this integration separately from its subsequent rate calculation.
This separation makes the plume mask scientifically consequential. Expanding an outline into noisy background can add mass that does not belong to the source, while truncating a weak plume can omit part of the detectable signal. Adjacent plumes can also complicate assignment. Preserve the outline and explain how it was selected. A reviewer needs more than the final mass number to determine whether two teams integrated comparable atmospheric structures or simply used different areas around the same candidate source. [1]
A source rate adds a transport model
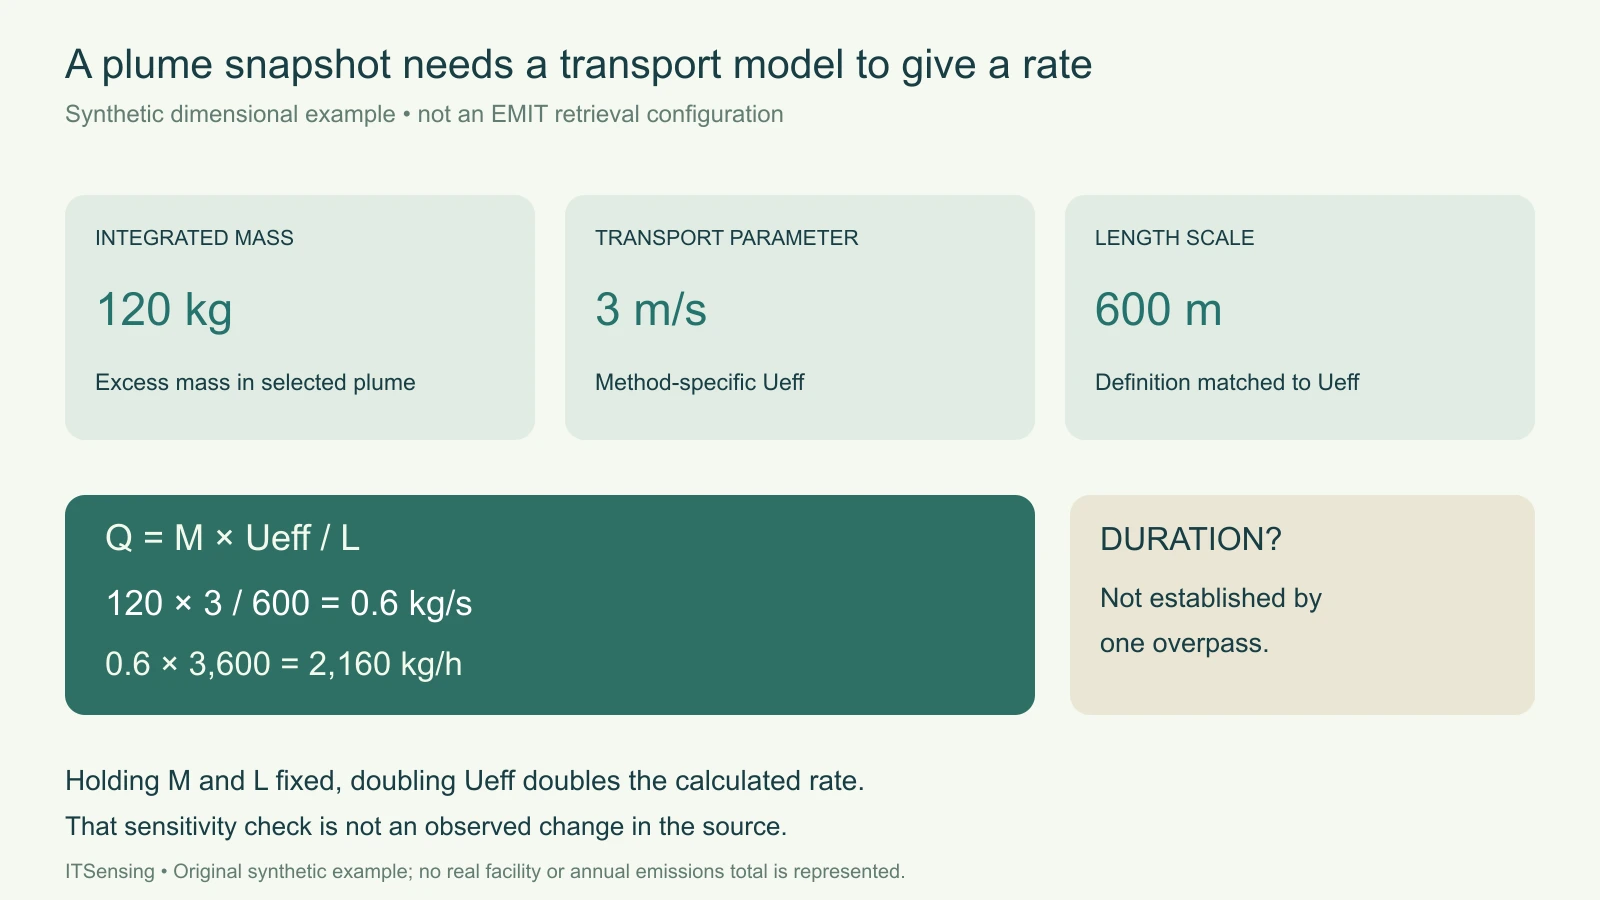
An IME-style rate estimate can be written schematically as Q = M × Ueff / L, where M is integrated excess mass, L is a defined plume extent parameter and Ueff is a method-specific transport parameter. The 2025 community-practices report hosted by NIST emphasizes that the effective-wind relationship and the definition of L are connected. Ueff is not a universal wind measurement that can be substituted independently of the formulation used to derive it. A wind product at a stated height also needs an explicit relationship to the chosen method.
Consider an invented mass of 120 kg, a transport parameter of 3 m/s and a length scale of 600 m. Their combination gives 0.6 kg/s, or 2160 kg/h. The units provide a useful check: metres cancel, leaving mass per time. The example is deliberately a dimensional calculation, not a calibration of any instrument or atmosphere. Its 120 kg is the mass in the modeled plume at the snapshot; it is not the amount emitted during one hour. [2]
Sensitivity is not the same as observing a changed source
Keep the invented mass and length fixed but substitute a transport parameter of 6 m/s. The calculated rate doubles to 4320 kg/h. That is a sensitivity experiment on the calculation, not an observation that a source doubled its emissions. In a real atmosphere, wind and turbulence can also change plume shape and the mass visible within the observation. Treating the numerical substitution as a complete physical simulation would ignore those interactions and imply evidence that was never collected.
A useful comparison retains the selected transport data, time alignment, plume segmentation and retrieval assumptions. If two estimates differ, examine those components before attributing the difference entirely to the source. The community report discusses uncertainty across the processing chain, including retrieval, segmentation and transport relationships. A rate with many decimal places is not necessarily more reliable than a rounded value accompanied by a transparent account of those uncertainties. Match reported precision to the evidence rather than to the number of digits returned by software. [2]
An overpass rate does not establish a yearly total
A rate can be integrated over a duration only when its temporal interpretation is justified. Multiplying a snapshot estimate by every hour in a year assumes that rate persisted through the entire period. One detection does not establish that condition. Repeated observations, operating records and a documented treatment of intermittency may support a broader inference, but they are additional evidence. A short-lived release and a sustained source could produce similar retrieved plume mass during the particular moment when either was observed.
Non-detection also needs context. UNEP's methane-observation guidance explains that cloud and insufficient sunlight can restrict satellite detection, and that smaller sources remain important alongside large detectable events. An unusable observation is not evidence of zero emissions. Keep usable observation opportunities separate from missing coverage when assessing persistence. Otherwise a region with persistent cloud could appear quiet simply because the relevant measurement was rarely available, while repeated clear observations elsewhere receive a very different interpretation. [3]
Deliver the observation and its inference as distinct evidence
A traceable scientific handover contains the acquisition, retrieval variable, units, background, plume outline, mass conversion, transport data, rate formulation and uncertainty interpretation. If a longer-period total is reported, add the duration model and the evidence for persistence or intermittency. Attribute a source only with the necessary spatial and operational corroboration. A nearby industrial feature can guide investigation, but proximity alone does not settle which equipment or activity produced an atmospheric signal.
The practical reading is to follow the units and the assumptions in order. Column enhancement supplies one kind of evidence; integrating the selected plume gives mass; a transport model supports a rate; and temporal evidence is needed for a longer-period total. Each step can be valuable without answering all the later questions. Preserving those boundaries makes methane remote sensing more useful for research and independent review because the reader can see exactly where an observation ends and an additional inference begins.