Ask what the ocean-color layer actually reports
A vivid chlorophyll map can make a coastal feature look biologically obvious, yet the product name describes a pigment concentration rather than a census of organisms. That difference matters when a scientist asks whether the pattern represents more phytoplankton, a different community or a potentially harmful bloom. Those questions are related, but they require different evidence. A standard chlorophyll-a value does not become an identified species simply because it is displayed with a familiar green color scale.
This explainer concerns the interpretation of standard ocean-color chlorophyll products, not a claim that every satellite algorithm has the same target or capability. Specialized optical and community-composition methods must be assessed on their own definitions and validation. The useful first step is to read the actual variable and units before assigning a biological label. From there, a researcher can design a comparison that tests what the retrieved field is meant to describe rather than expecting one layer to answer every ecological question.
Chlorophyll-a is retrieved from spectral information
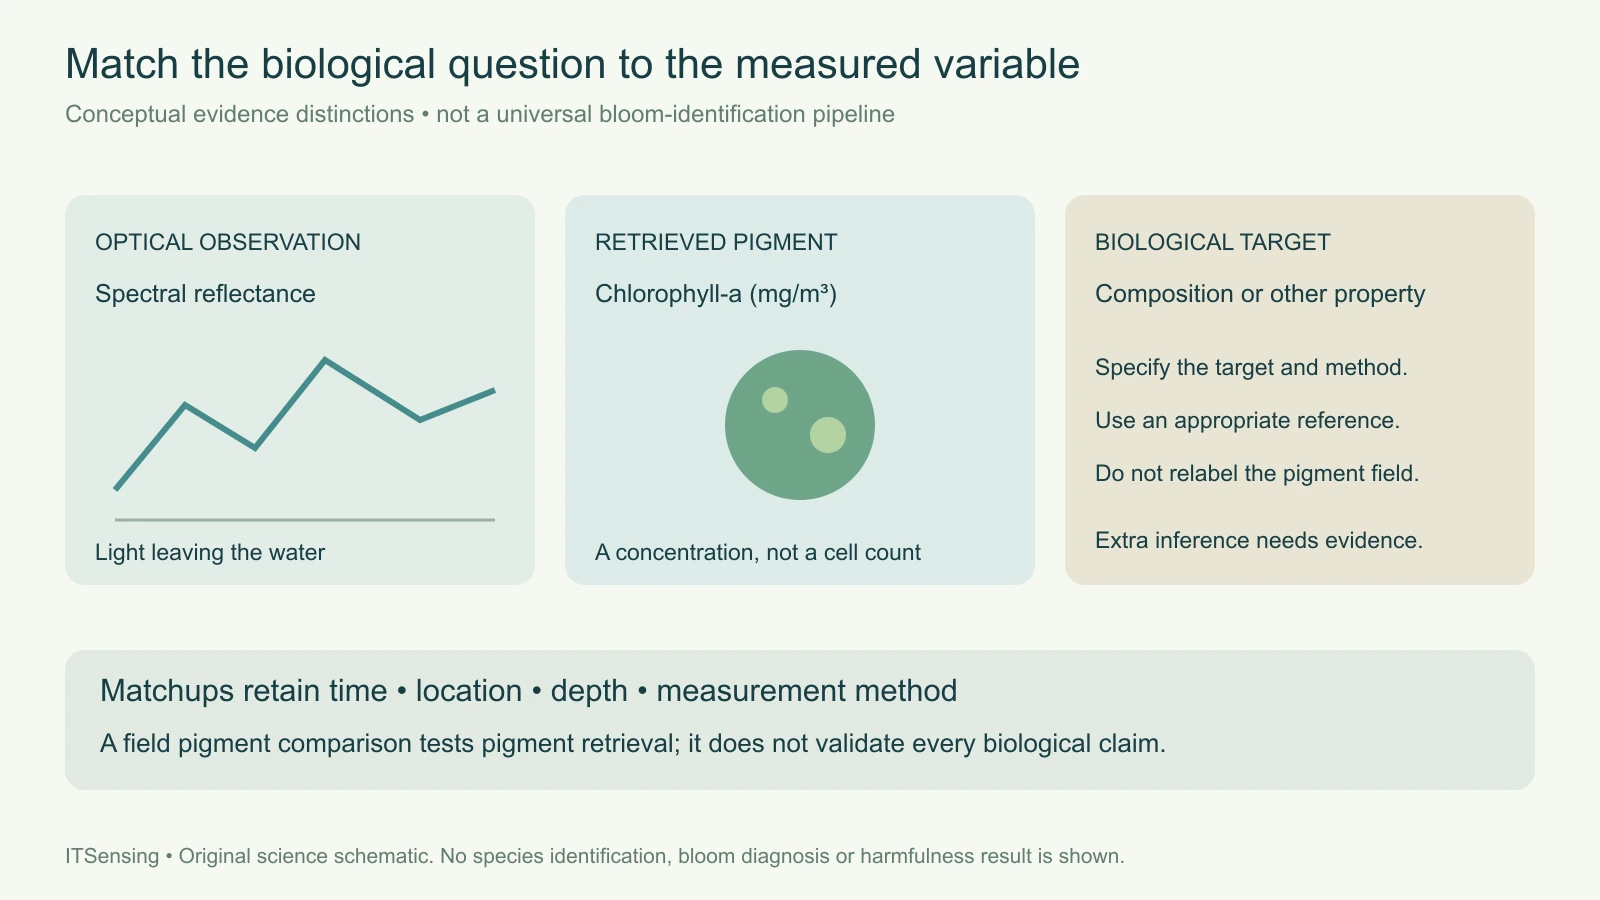
NASA's chlorophyll-a algorithm document defines the output as near-surface pigment concentration in milligrams per cubic metre, estimated through empirical relationships between field measurements and spectral remote-sensing reflectance. It describes a hybrid approach combining band-ratio and color-index information for its documented processing version. The underlying observation is light leaving the water at selected wavelengths; the concentration is a derived quantity supported by a relationship between those optical measurements and reference pigment measurements.
That chain should remain visible in a scientific report. Retain the sensor, processing version, algorithm, quality information and reflectance context rather than labeling the output simply as algae. An RGB image, a remote-sensing-reflectance spectrum and a retrieved pigment concentration are different representations. A change in display stretching can make a pattern look more dramatic without changing the underlying concentration values. Use a consistent numerical representation when comparing dates, and keep the original units beside any normalized or color-coded summary. [1]
Pigment mass does not count cells or identify a community
The units alone reveal an important limit: milligrams of pigment per cubic metre are not cells per litre and not a taxonomic label. Converting between pigment concentration and an organism count would require additional information about what organisms are present and their pigment content. A mixed community can contribute to one integrated optical signal. Even if two water samples have similar chlorophyll concentration, that numerical agreement does not establish that their biological composition is identical.
Consider two hypothetical coastal samples with the same measured chlorophyll-a concentration. A laboratory could still describe different mixtures of organisms in them. A standard chlorophyll product designed to estimate that shared pigment quantity has not necessarily failed by giving similar values for those samples. The error would be in expecting the pigment field to distinguish a target it was not defined to measure. State the biological question first, then choose the reference observation and product whose definitions can actually test it.
Keep specialized products separate from the standard pigment field
The distinction is not an argument against using richer spectral information. NASA's PACE documentation describes aquatic biogeochemistry as a suite of selected metrics produced through different algorithms, and distinguishes chlorophyll from other quantities such as particulate organic carbon. That product-specific approach is important: a field targeting one property should not silently inherit the scientific meaning of another field merely because both were generated from the same instrument or appear in the same catalog.
For a community-composition or bloom-type analysis, read the relevant method, supported water conditions, output classes and independent evaluation. Ask whether the result represents a broad optical group, a statistical association or a more specific biological identification. Do not transfer a demonstrated relationship to a new coastline without reviewing the supporting observations. Conversely, do not interpret the limitations of a standard chlorophyll field as proof that no specialized remote-sensing approach can provide additional biological information. The scientific target and evidence must be evaluated together. [2]
Optical support and sampling support can differ
A satellite observation summarizes an optically sensed surface layer over a footprint and acquisition time. A bottle sample or microscope record has its own location, depth, collection time and measurement procedure. NOAA's bloom-monitoring guidance notes that patchiness and vertical mixing can help explain disagreement between imagery and sampling. A feature that is less evident at the surface on one day has not necessarily disappeared throughout the water column. Matching a sample to an image requires more than placing both within the same named bay.
Build a matchup record that retains time difference, sample depth, spatial separation, surrounding image variability and relevant quality flags. Examine whether a sample collected near a sharp front represents the same mixture as the satellite footprint. Keep unsupported observations out of the comparison without interpreting their exclusion as a low pigment value. The purpose is to understand which differences could arise from measurement support before treating every residual as an algorithm error or a biological change. [3]
Validate the requested quantity with the appropriate reference
NASA's PACE biogeochemical validation page describes comparing satellite chlorophyll estimates with field chlorophyll measurements analyzed using high-pressure liquid chromatography, with quality control and spatial-temporal matchup criteria. That is a test of a pigment product against a pigment reference. It does not automatically validate species identification, organism abundance or a separate assessment of harmfulness. Each additional claim needs a reference observation that measures the relevant target, together with an appropriate comparison design.
For a monitoring project, separate the questions in the data dictionary. One field can report a retrieved pigment concentration, another a confirmed community observation, and another the status of an independent biological investigation. Preserve their dates and methods rather than combining them into a single authoritative-looking category. If the practical question concerns a harmful bloom, the evidence must address that question specifically; a strong pigment signal alone is not a complete assessment. This is an observation-design issue, not a reason to discard the spatial context supplied by satellite imagery. [2]
Report the spatial finding without overstating its biology
A useful handover identifies the chlorophyll product, units, observation period, quality policy, footprint support and available field matchups. Describe an anomaly relative to a documented baseline and show where independent observations support a more specific interpretation. If the community composition remains unresolved, retain that status explicitly. A map can still direct sampling or help place local observations in a broader coastal pattern while leaving the unmeasured biological properties open for investigation.
The central discipline is to preserve the identity of the variable through every figure and summary. Reflectance provides optical evidence; a documented algorithm estimates pigment concentration; additional products or field observations may address community structure and other biological properties. Treating those as distinct targets makes the analysis more useful because a reader can assess what was measured and what was inferred. A standard chlorophyll map is a valuable scientific observation without being asked to act as a complete species census.
Sources and technical reading
- [1] NASA OB.DAAC chlorophyll-a algorithm theoretical basis, v1.1: definition and documented hybrid retrieval
- [2] NASA PACE biogeochemical products: chlorophyll, carbon and field-validation matchups
- [3] NOAA NCCOS bloom-monitoring information: optical proxies, patchiness, vertical mixing and sampling support