What Resourcesat-2 measures and why it matters
Resourcesat-2 continued the LISS-IV, LISS-III, and AWiFS resource-observation concept. Spectral bands, acquisition geometry, and archive licensing must be checked for the selected product.
The practical review question is continuing a regional agricultural land-cover record. This gives the mission a defined role in a project instead of treating a satellite specification as a general promise of better mapping. Start by identifying the physical variable, geographic extent, observation period, and smallest feature that would change the intended decision. A suitable instrument is one whose measurement and available product can answer that question with a defensible level of uncertainty.
For Resourcesat-2, the central interpretation risk is that a nominally similar sensor name does not remove calibration or processing differences. That risk should influence data selection, preprocessing, validation, and the wording of the final map. More pixels or a stronger visual contrast will not resolve a mismatch between the measured quantity and the conclusion being requested. Keep the mission-specific limitation visible while assessing whether another sensor, field observation, or ancillary dataset is needed.
Read the bands before calculating an index
Optical land imagery records radiation within specific wavelength intervals. A red band, a near-infrared band, and a shortwave-infrared band are different measurements, even when all are displayed using a similar colour ramp. Match an index formula to the actual sensor band definitions, not to a band number copied from another mission. An index requiring shortwave infrared cannot be reconstructed from a visible and near-infrared camera simply by renaming its channels.
For change detection, distinguish top-of-atmosphere radiance or reflectance from a surface-reflectance retrieval. Atmospheric correction reduces selected effects under stated assumptions; it does not remove every cloud edge, haze residual, adjacency effect, or terrain-shadow problem. Keep the product scaling and offset with the raster. A display stretch is useful for interpretation but should never become the numerical input to a calibrated comparison.
Choose a mapping unit the imagery can support
A land-cover pixel can contain vegetation, soil, water, buildings, and shadow simultaneously. The dominant colour does not prove that one pure material fills the whole footprint. Delineate a minimum mapping unit appropriate to native band resolution and positional uncertainty. At parcel edges, consider interior masks or fractional coverage rather than interpreting every boundary pixel as a separate reliable class. This is especially important when comparing a historical coarse sensor with a newer instrument.
Treat resampling as a geometric operation with consequences for analysis. Nearest-neighbour resampling preserves categorical labels, while interpolation can be appropriate for some continuous quantities. Neither method creates finer independent observations. Keep cloud, shadow, saturation, and no-data masks aligned with the imagery and explain whether area statistics use all pixels or only valid observations. An unobserved surface should remain unobserved rather than becoming a confident zero.
A project workflow for Resourcesat-2
A defensible starting workflow is to preserve product metadata and compare overlap reference areas before extending a classification model. Make this a documented sequence with input scene identifiers, processing collection, acquisition timestamps, quality exclusions, and output definitions. Inspect representative observations before running a large batch. This small review often exposes a missing band, unsupported retrieval condition, geometry mismatch, or archive gap that would otherwise propagate through every exported layer.
Keep source measurements and derived indicators separate. A GIS can display both, but their metadata should explain which layer comes directly from the selected Resourcesat-2 product and which includes an additional classification, interpolation, statistical summary, or physical model. Store masks and uncertainty information with the result. If an analysis changes scale through aggregation or resampling, record that transformation rather than implying that the source instrument measured the new reporting units directly.
A repeatable workflow also needs a clear rule for missing or rejected observations. Do not substitute zero for no data or interpolate silently through an important event. Report how much of the target area was observed and which dates actually contribute to the result. If the available evidence cannot answer the original question, narrow the geographic or temporal claim or obtain complementary observations before presenting a management conclusion.
An illustrative interpretation check
Consider a hypothetical comparison between two agricultural seasons. One polygon has 100 eligible analysis cells, but cloud and shadow remove 30 on the second date. A mean calculated from the remaining 70 cells describes the observed portion, not the entire original polygon. Compare a common valid footprint or explain the coverage difference. If the missing area contains a wetter or differently planted field, the apparent spectral change can be a sampling effect.
The same logic applies to the target question of continuing a regional agricultural land-cover record. Use the example as a comparison design, then replace its hypothetical conditions with the actual scene and reference metadata. It is not a published performance result for Resourcesat-2. A reproducible interpretation should make it possible for another analyst to see which observation supports the claim and which part depends on an assumption that still needs testing.
Validation, specifications, and responsible comparison
Evaluate Resourcesat-2 against independent evidence that measures a comparable quantity at a compatible time and scale. Keep validation observations separate from training or tuning inputs. Include both typical conditions and difficult environments, and report important errors by class or surface type where that affects the intended decision. One attractive scene or a high agreement statistic from a convenient subset does not establish performance across a different region, season, or processing version.
Use the official references below to verify instrument design and product documentation. Operational status, acquisition schedules, archive holdings, processing collections, commercial terms, and access mechanisms can change; check those details for the actual project date. A nominal orbit repeat or advertised resolution is an instrument or service specification, not proof that a usable observation exists for a particular target. Preserve this distinction when comparing candidate missions or planning a monitoring frequency.
Keep an export manifest containing the original scene identifier, provider, product version, coordinate reference, units, masks, and processing parameters. This record makes a later review possible even if a catalogue interface changes. It also allows a collaborator to distinguish a revised algorithm output from a newly acquired observation without relying on the appearance of the map.
Bring the evidence into an iT Sensing project
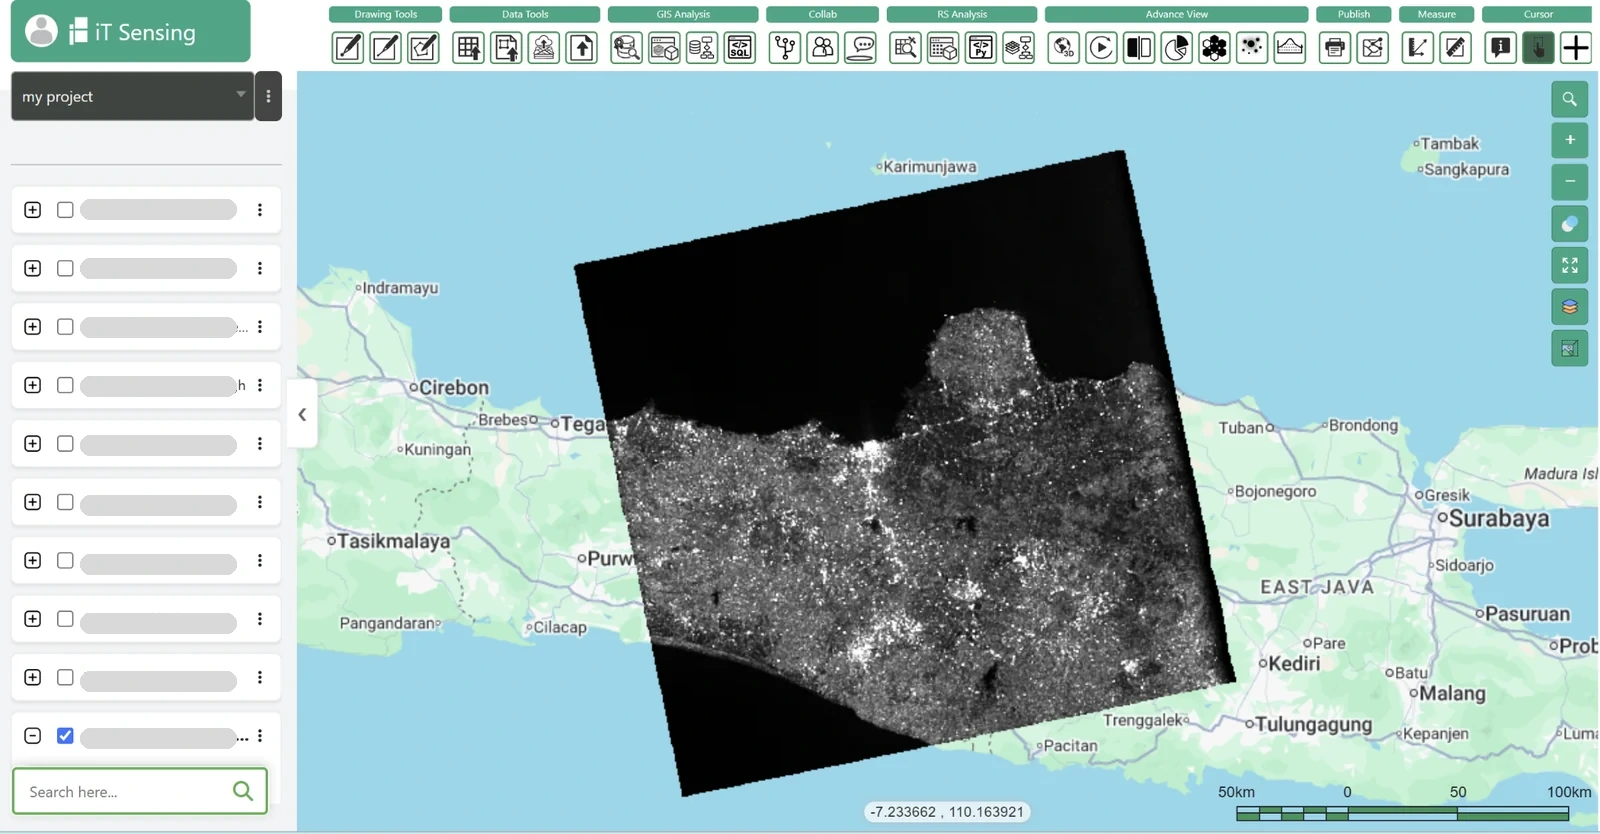
Use the documented iT Sensing workflow to organize satellite-data discovery, raster analysis, model development, and the resulting GIS context. For Resourcesat-2, first confirm that the required product, format, quality fields, and processing operation are supported by the specific workspace or acquisition channel being used. This article reviews the mission; it does not assert that every instrument product is automatically available, licensed, or fully processed inside a particular subscription.
The useful handover is a source-linked map and analysis table that explain continuing a regional agricultural land-cover record, retain the valid observation footprint, and state the evidence behind the conclusion. Link the result to the project documentation and the relevant data-selection record so collaborators can repeat the comparison. A clear account of measurement, processing, uncertainty, and intended action gives satellite imagery practical value beyond a visually convincing map.