What EO-1 Hyperion measures and why it matters
Hyperion supplied spaceborne imaging-spectroscopy observations with many narrow spectral channels. Bad bands, atmospheric absorption regions, and detector effects need explicit treatment.
The practical review question is testing whether narrowband information helps separate geological surface materials. This gives the mission a defined role in a project instead of treating a satellite specification as a general promise of better mapping. Start by identifying the physical variable, geographic extent, observation period, and smallest feature that would change the intended decision. A suitable instrument is one whose measurement and available product can answer that question with a defensible level of uncertainty.
For EO-1 Hyperion, the central interpretation risk is that hundreds of channels do not imply hundreds of independent useful predictors. That risk should influence data selection, preprocessing, validation, and the wording of the final map. More pixels or a stronger visual contrast will not resolve a mismatch between the measured quantity and the conclusion being requested. Keep the mission-specific limitation visible while assessing whether another sensor, field observation, or ancillary dataset is needed.
Treat spectral information as calibrated measurements
Imaging spectroscopy samples many narrow wavelength intervals, creating a detailed spectral signature for each observed footprint. That richness is useful only when calibration, noise, atmospheric correction, and unusable channels are handled carefully. Water-vapour absorption regions and low-signal bands may need exclusion. Keep wavelength and bandwidth metadata alongside the raster; a stack of numbered channels without that information is difficult to interpret or reproduce.
Material spectra depend on mixtures, grain size, moisture, illumination, and viewing geometry. A library match is therefore a hypothesis about a surface rather than automatic confirmation of a pure mineral or plant species. Compare candidate explanations and use field or laboratory reference information appropriate to the observation. Preserve the distinction between sensor radiance, retrieved surface reflectance, and a classified or unmixed material estimate.
Control dimensionality and evaluate transferability
Many narrow bands can make a classifier appear powerful while increasing the risk of overfitting. Feature selection, dimensionality reduction, and regularization should be evaluated using genuinely independent samples. Nearby pixels from the same material patch should not be split casually between training and testing, because spatial dependence can make the reported accuracy unrealistically optimistic. Keep the validation geography and sampling design explicit.
A model trained on one geological site or vegetation condition may not transfer to another atmosphere, season, soil background, or instrument. Review spectral response and preprocessing before applying a model elsewhere. Report uncertain mixtures and classes outside the reference range instead of forcing every pixel into a known material. The practical deliverable is a calibrated, quality-screened spectral interpretation with evidence for the intended target classes.
A project workflow for EO-1 Hyperion
A defensible starting workflow is to remove documented unusable channels, evaluate spectral noise, and validate material classes with independent reference samples. Make this a documented sequence with input scene identifiers, processing collection, acquisition timestamps, quality exclusions, and output definitions. Inspect representative observations before running a large batch. This small review often exposes a missing band, unsupported retrieval condition, geometry mismatch, or archive gap that would otherwise propagate through every exported layer.
Keep source measurements and derived indicators separate. A GIS can display both, but their metadata should explain which layer comes directly from the selected EO-1 Hyperion product and which includes an additional classification, interpolation, statistical summary, or physical model. Store masks and uncertainty information with the result. If an analysis changes scale through aggregation or resampling, record that transformation rather than implying that the source instrument measured the new reporting units directly.
A repeatable workflow also needs a clear rule for missing or rejected observations. Do not substitute zero for no data or interpolate silently through an important event. Report how much of the target area was observed and which dates actually contribute to the result. If the available evidence cannot answer the original question, narrow the geographic or temporal claim or obtain complementary observations before presenting a management conclusion.
An illustrative interpretation check
Imagine a classifier with excellent random-pixel accuracy because neighbouring spectra from the same exposed rock patch appear in both training and testing. Hold out complete independent patches or sites and reassess the mineral classes. The lower result may better represent transfer to an unmapped area. Keep uncertain mixtures and unusable channels visible. Spectral richness is valuable, but it does not replace independent reference material and a validation design that prevents spatial leakage.
The same logic applies to the target question of testing whether narrowband information helps separate geological surface materials. Use the example as a comparison design, then replace its hypothetical conditions with the actual scene and reference metadata. It is not a published performance result for EO-1 Hyperion. A reproducible interpretation should make it possible for another analyst to see which observation supports the claim and which part depends on an assumption that still needs testing.
Validation, specifications, and responsible comparison
Evaluate EO-1 Hyperion against independent evidence that measures a comparable quantity at a compatible time and scale. Keep validation observations separate from training or tuning inputs. Include both typical conditions and difficult environments, and report important errors by class or surface type where that affects the intended decision. One attractive scene or a high agreement statistic from a convenient subset does not establish performance across a different region, season, or processing version.
Use the official references below to verify instrument design and product documentation. Operational status, acquisition schedules, archive holdings, processing collections, commercial terms, and access mechanisms can change; check those details for the actual project date. A nominal orbit repeat or advertised resolution is an instrument or service specification, not proof that a usable observation exists for a particular target. Preserve this distinction when comparing candidate missions or planning a monitoring frequency.
Keep an export manifest containing the original scene identifier, provider, product version, coordinate reference, units, masks, and processing parameters. This record makes a later review possible even if a catalogue interface changes. It also allows a collaborator to distinguish a revised algorithm output from a newly acquired observation without relying on the appearance of the map.
Bring the evidence into an iT Sensing project
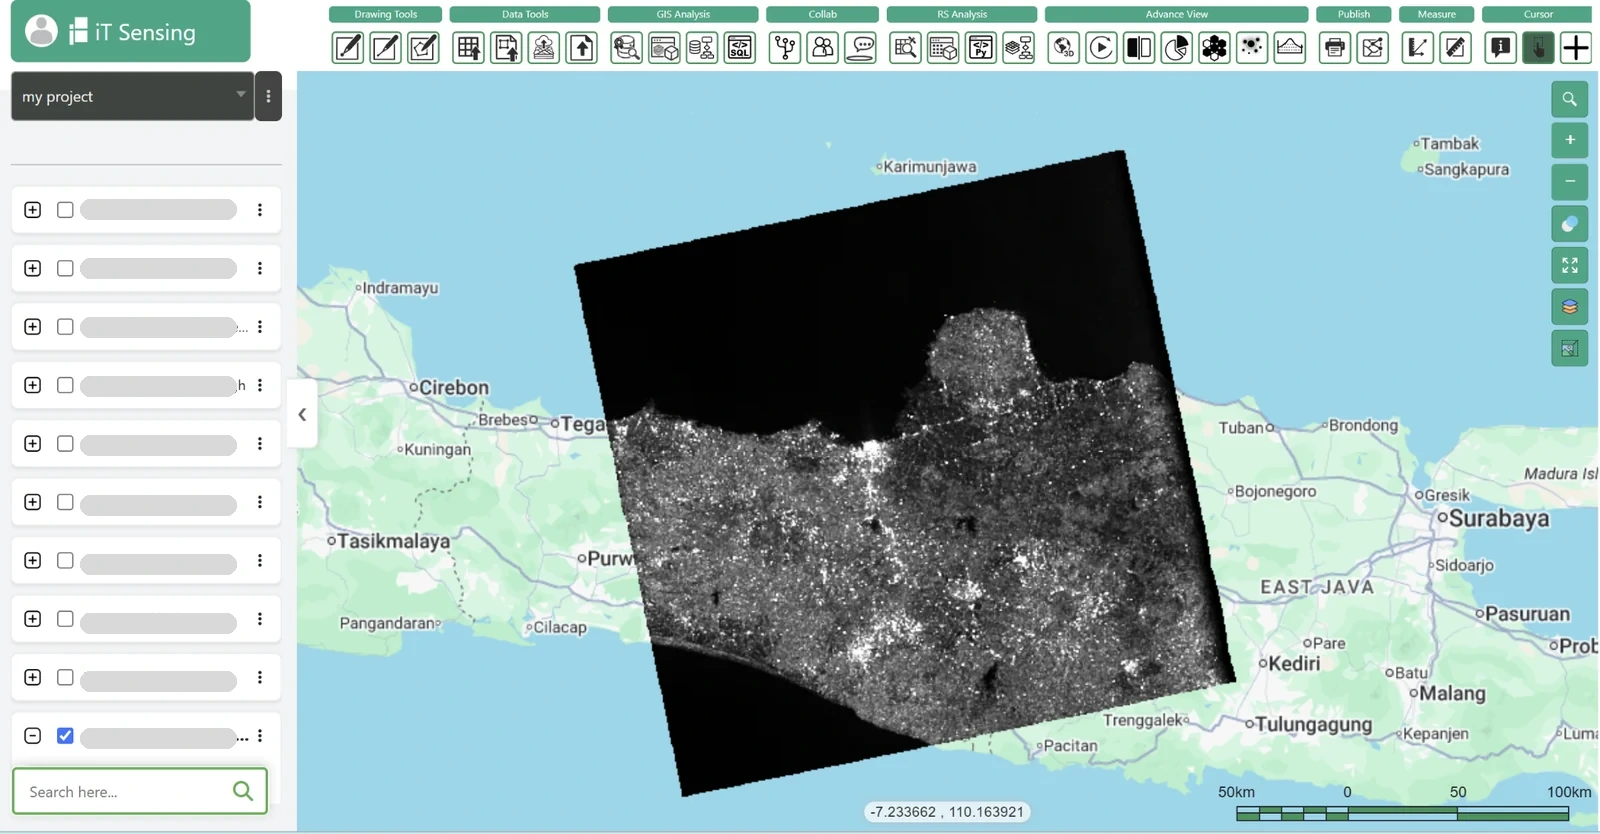
Use the documented iT Sensing workflow to organize satellite-data discovery, raster analysis, model development, and the resulting GIS context. For EO-1 Hyperion, first confirm that the required product, format, quality fields, and processing operation are supported by the specific workspace or acquisition channel being used. This article reviews the mission; it does not assert that every instrument product is automatically available, licensed, or fully processed inside a particular subscription.
The useful handover is a source-linked map and analysis table that explain testing whether narrowband information helps separate geological surface materials, retain the valid observation footprint, and state the evidence behind the conclusion. Link the result to the project documentation and the relevant data-selection record so collaborators can repeat the comparison. A clear account of measurement, processing, uncertainty, and intended action gives satellite imagery practical value beyond a visually convincing map.