Begin with the decision and the observable target
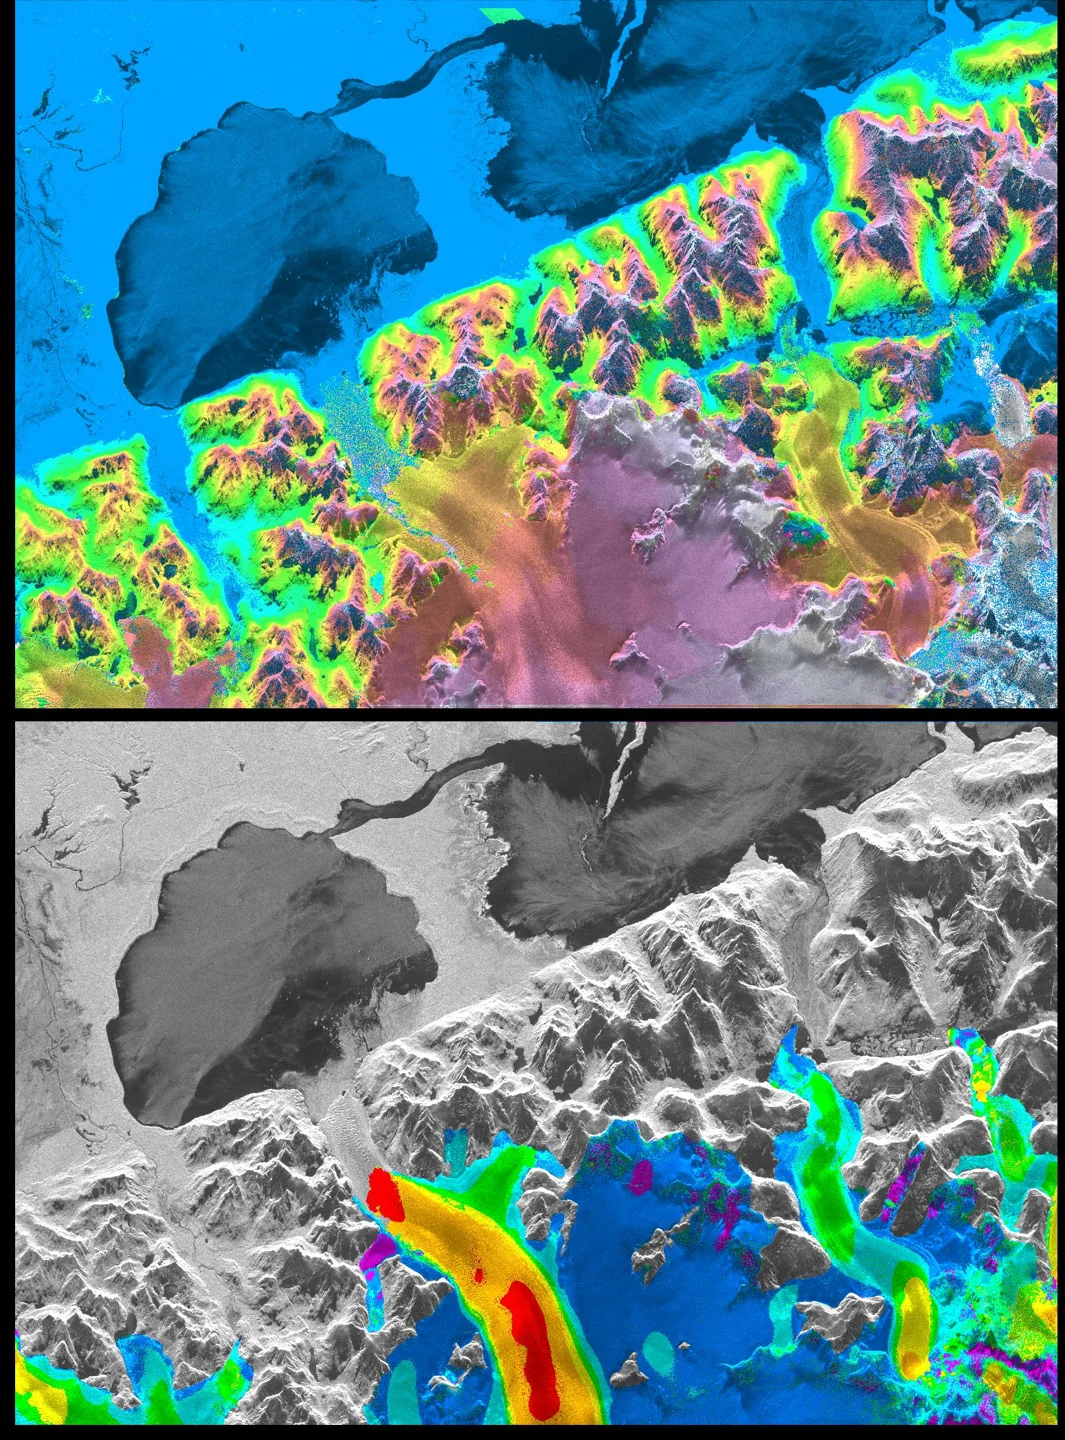
The practical question is: Which visible fractures or rifts show supported geometric change? Work with ice shelf fracture observation zones as the reporting unit and define the observation period before choosing an image or algorithm. Suitable optical and radar observations can document major rift positions and changes in shelf geometry.
Cryosphere observations need careful separation of ice, seasonal snow, liquid water, debris and unobserved terrain. Their appearance changes with season, illumination and surface melt. A consistent annual comparison should therefore use an appropriate physical window rather than blindly selecting the same calendar day. Clouds and deep shadows reduce coverage, while radar geometry and changing scattering conditions introduce other limitations. Retain the observation support and processing definitions used for every mapped edge or area. Ice extent, concentration, thickness, surface displacement and mass balance are different measurements; a change in one should not be presented as direct measurement of another. Field and independent geophysical observations help establish that relationship where needed. For remote basins with sparse references, report the evidence gap openly. A qualified regional trend can support scientific investigation, but detailed hazard forecasts or navigation decisions require the responsible specialist services and their broader observations.
Select observations with suitable physical and temporal support
Radar provides active microwave observations and can acquire data without sunlight through cloud conditions that limit optical imagery. This advantage does not remove geometric and physical interpretation problems. Choose a compatible acquisition mode, polarization, orbit direction and processing level for the task. Backscatter intensity, coherence and interferometric phase contain different information and require different workflows. Terrain correction, incidence angle, speckle and layover or shadow can materially affect a result. A smooth dark radar surface is not universally water, and a low-coherence area is not universally damage. Examine known stable examples and relevant land-cover contexts before choosing thresholds. Maintain acquisition geometry and quality information in the project record. For interferometry, use dedicated processing with documented references and independent validation; a general raster analysis interface alone does not establish that an operational interferometric chain has been implemented or evaluated.
Build a compact data manifest before processing. Record the area of interest, acquisition times, product identifiers, processing versions, bands or variables, units, scale factors and quality criteria. Check the actual usable coverage over the target rather than relying only on scene-wide quality percentages. Preserve the original masks and define how missing values propagate into derived layers. If several dates or sensors are combined, keep their support information available in the project. These details make it possible to repeat a measurement and to explain why a later run changes after a product revision. They also help a colleague decide whether an apparent disagreement comes from the environment, the observation conditions or a processing choice.
Build an analysis rule that can be reviewed
Trace only supported features, retain positional uncertainty and compare compatible acquisition geometry.
Object mapping requires an explicit rule for what counts as one feature. Specify minimum detectable size, splitting and merging behavior and how uncertain boundaries are handled. A connected image patch may represent several management units, while one physical feature can be divided by shadows or missing data. Check object counts and areas separately because a method can achieve reasonable total area while splitting the inventory incorrectly. Retain stable identifiers through updates and preserve links to the source observation. Review a representative sample of candidate objects and noncandidate surroundings so evaluation can reveal both false detections and missed features. When exact boundaries are unsupported, use a candidate zone or point for inspection rather than drawing a precise-looking polygon whose geometry the imagery cannot defend.
Start with a small, independently reviewed subset before applying the rule across the full geography. Inspect inputs and intermediate layers at both overview and local scales, checking that units, masks and coordinate alignment behave as intended. Keep a named version of the analysis configuration and retain a concise explanation of every consequential threshold. When the workflow moves to another region or season, revisit those assumptions instead of assuming that successful execution proves scientific transfer. A repeatable pipeline is valuable because its choices can be inspected and revised, not because automation makes the interpretation automatically correct.
Interpret the result without hiding alternative explanations
Snow cover, viewing geometry and resolution hide or distort narrow fractures. A visible rift does not independently predict a calving date.
Keep the target interpretation distinct from the evidence used to support it. For ice shelf fracture observation zones, ask whether the observed pattern persists under a reasonable alternative baseline, quality mask or aggregation. Review apparent successes and plausible counterexamples together. If competing explanations cannot be separated with the available observations, record the finding as a candidate for investigation. This preserves useful spatial information while showing exactly which part of the conclusion still depends on independent evidence. The next observation should be chosen to resolve that uncertainty, rather than simply to reproduce a similar-looking map.
Validate with independent evidence before scaling
Use independent glaciological observations and detailed reference imagery.
Design the reference sample to represent the intended map use, including difficult boundaries and locations the classifier did not flag. Keep the sample independent of training and threshold adjustment. If rare target classes are deliberately oversampled, retain selection probabilities so population-level estimates can be calculated appropriately. Build a confusion matrix using a consistent reference definition and report omission as well as commission error. Check observer agreement where labels require interpretation. Report results by meaningful context, such as terrain, target size or season, when performance differs. A map evaluated only on easy interior examples cannot justify claims about narrow edges or mixed landscapes. Keep the reference evidence available for audit and distinguish uncertain reference labels from certain ones rather than forcing every sample into a definitive category.
Deliver a usable GIS evidence layer
Deliver a dated feature inventory without unsupported event forecasts.
For GIS delivery, retain stable feature identifiers, source observation dates, the physical variable, units, valid support area, uncertainty and review status. Use a suitable coordinate reference for any area or distance calculation and document the transformation when joining outside layers. Separate measured or observed attributes from modeled and field-confirmed attributes so users can update one evidence type without overwriting the others. Include an unknown or unsupported state in summaries and preserve the denominator used for percentages. A map legend, concise data dictionary and accessible source links make the result useful to colleagues who did not run the analysis. Export formats should match the actual downstream workflow, with attribute encoding and geometry checked before handoff.
Turn the method into a practical iT Sensing workflow
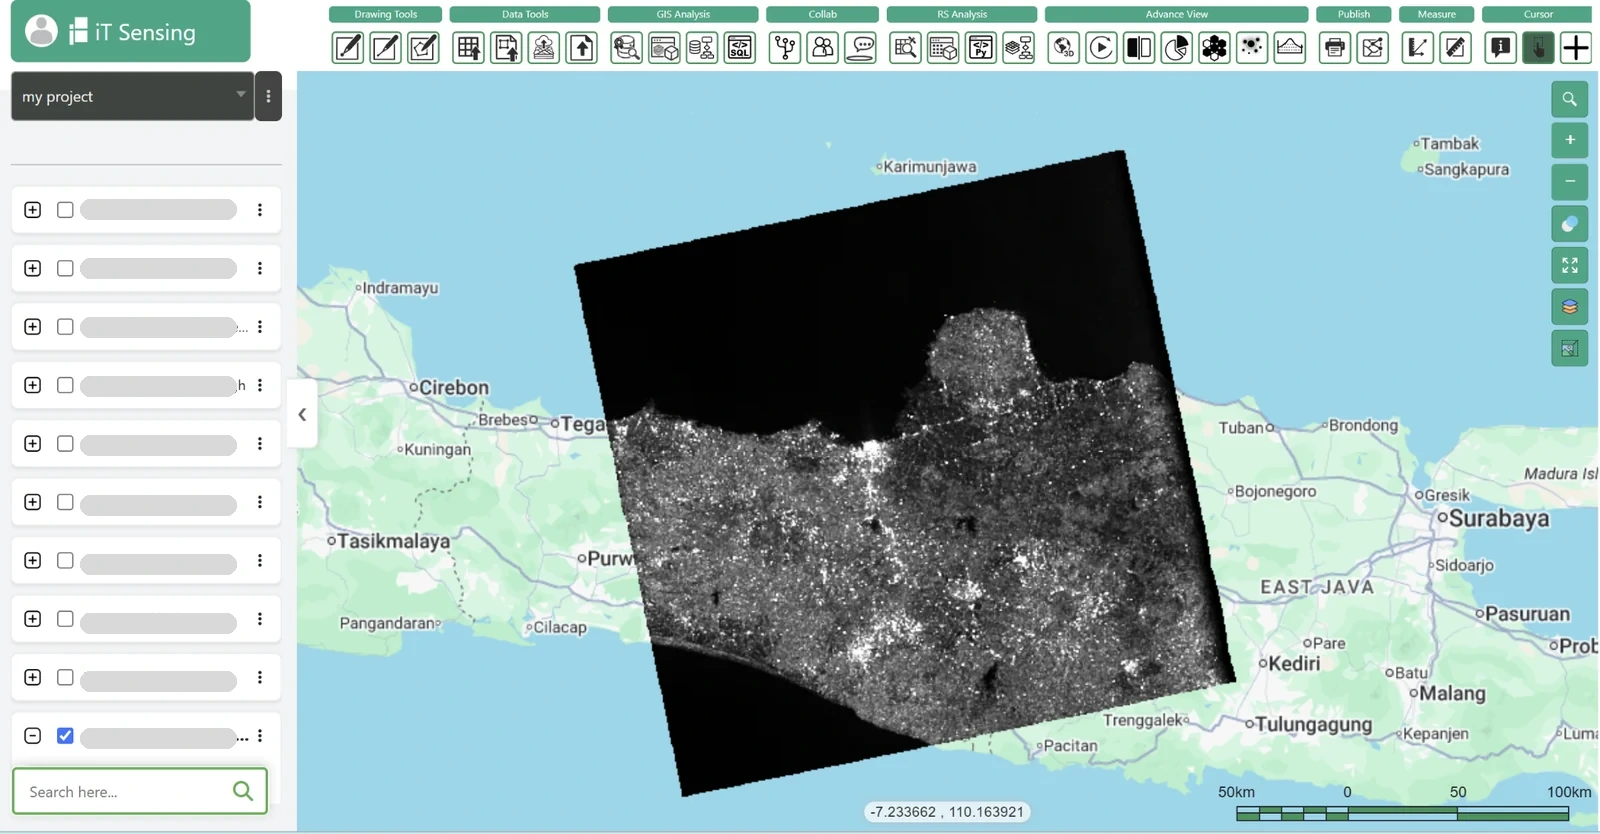
iT Sensing brings satellite discovery, raster analysis, machine learning, GeoAI, visual model workflows and Python experimentation into a cloud remote sensing workspace. Use its documented tools to organize the inputs, test appropriate raster operations and connect evaluated results to a project-aware GIS workflow. The existence of a general tool does not guarantee that every specialist retrieval described here is available as a ready-made operation. Check the documentation and, where necessary, bring independently processed and evaluated products into the project with their provenance intact. A practical next step is to test the workflow on a representative area, review the evidence with domain specialists and choose the workspace plan that fits the team’s real storage, collaboration and processing needs.